Manipulate your Genomic Observatory Data
What is MyGOD ?
MyGOD (Manipulate your Genomic Observatory Data) is an on-line tool to visualize and explore data collected by one or several genome observatories. In its current (beta) version, MyGOD can ingest metabarcode data as well as physico-chemical measurements. Future releases will include "classical" biodiversity data (occurrence tables). Similarly, this release of MyGOD is focused on searching and visualising data based on taxon descriptors (i.e.: names and ranks in a taxonomy). Extension to sequence based searches is also planned.
Using MyGOD
Taxon Based Search and Visualisation
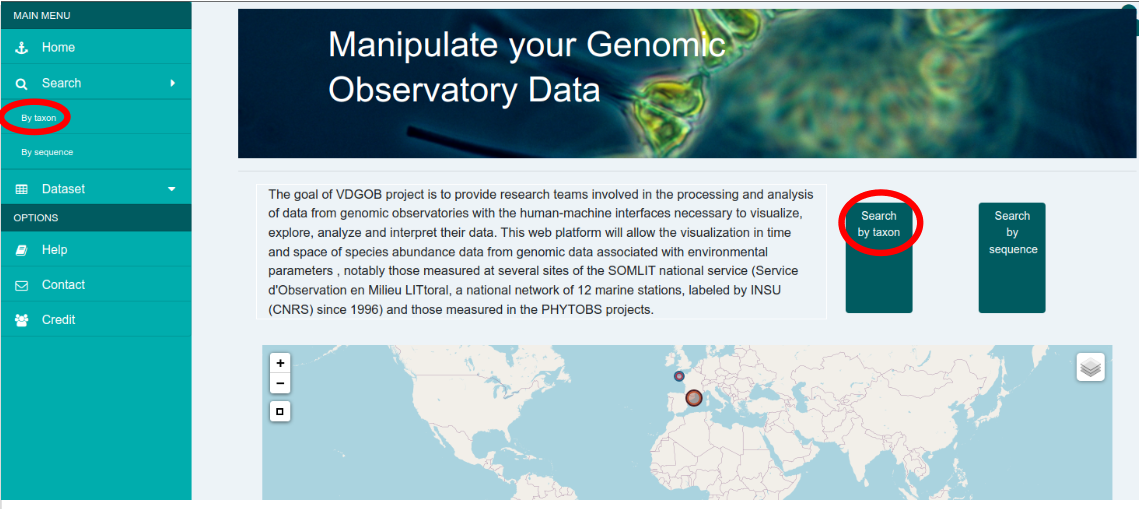
Taxon based search and visualisation allow users to display various types of graphical representations centered around one of several taxons of interest (cf. Taxonomy Management below for details about how MyGOD handles taxonomies). This is achieved through the use of a dashboard which can be reached either by clicking on the "Search by taxon" button on the home page, or by using the "By taxon" entry in the "Search" menu of the left sidebar. This opens the dashboard view.
The Dashboard View
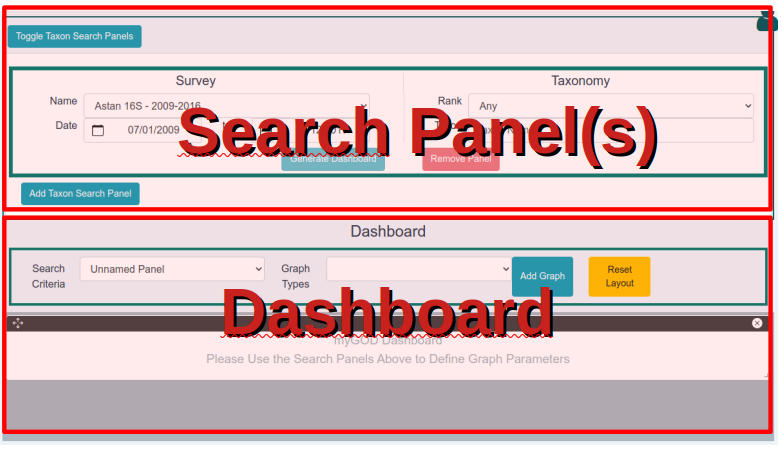
The dashboard view is subdivided in two main sections. At the top, one or more Search Panels can be used to narrow down the search according to various criteria. At the bottom, the actual dashboard is a canvas where users can add/more/remove various widgets (mainly plots and maps) to build visualisations that best expose a phenomenon of interest.
Defining Taxon Search Criteria
A taxon search panel is divided in two parts. On the left hand side, there are menus for selecting one of the available datasets, as well
as a specific date range. On the right hand side, a menu allows to select, if needed, a specific rank in the taxonomy that is associated to the
selected dataset. By default, the
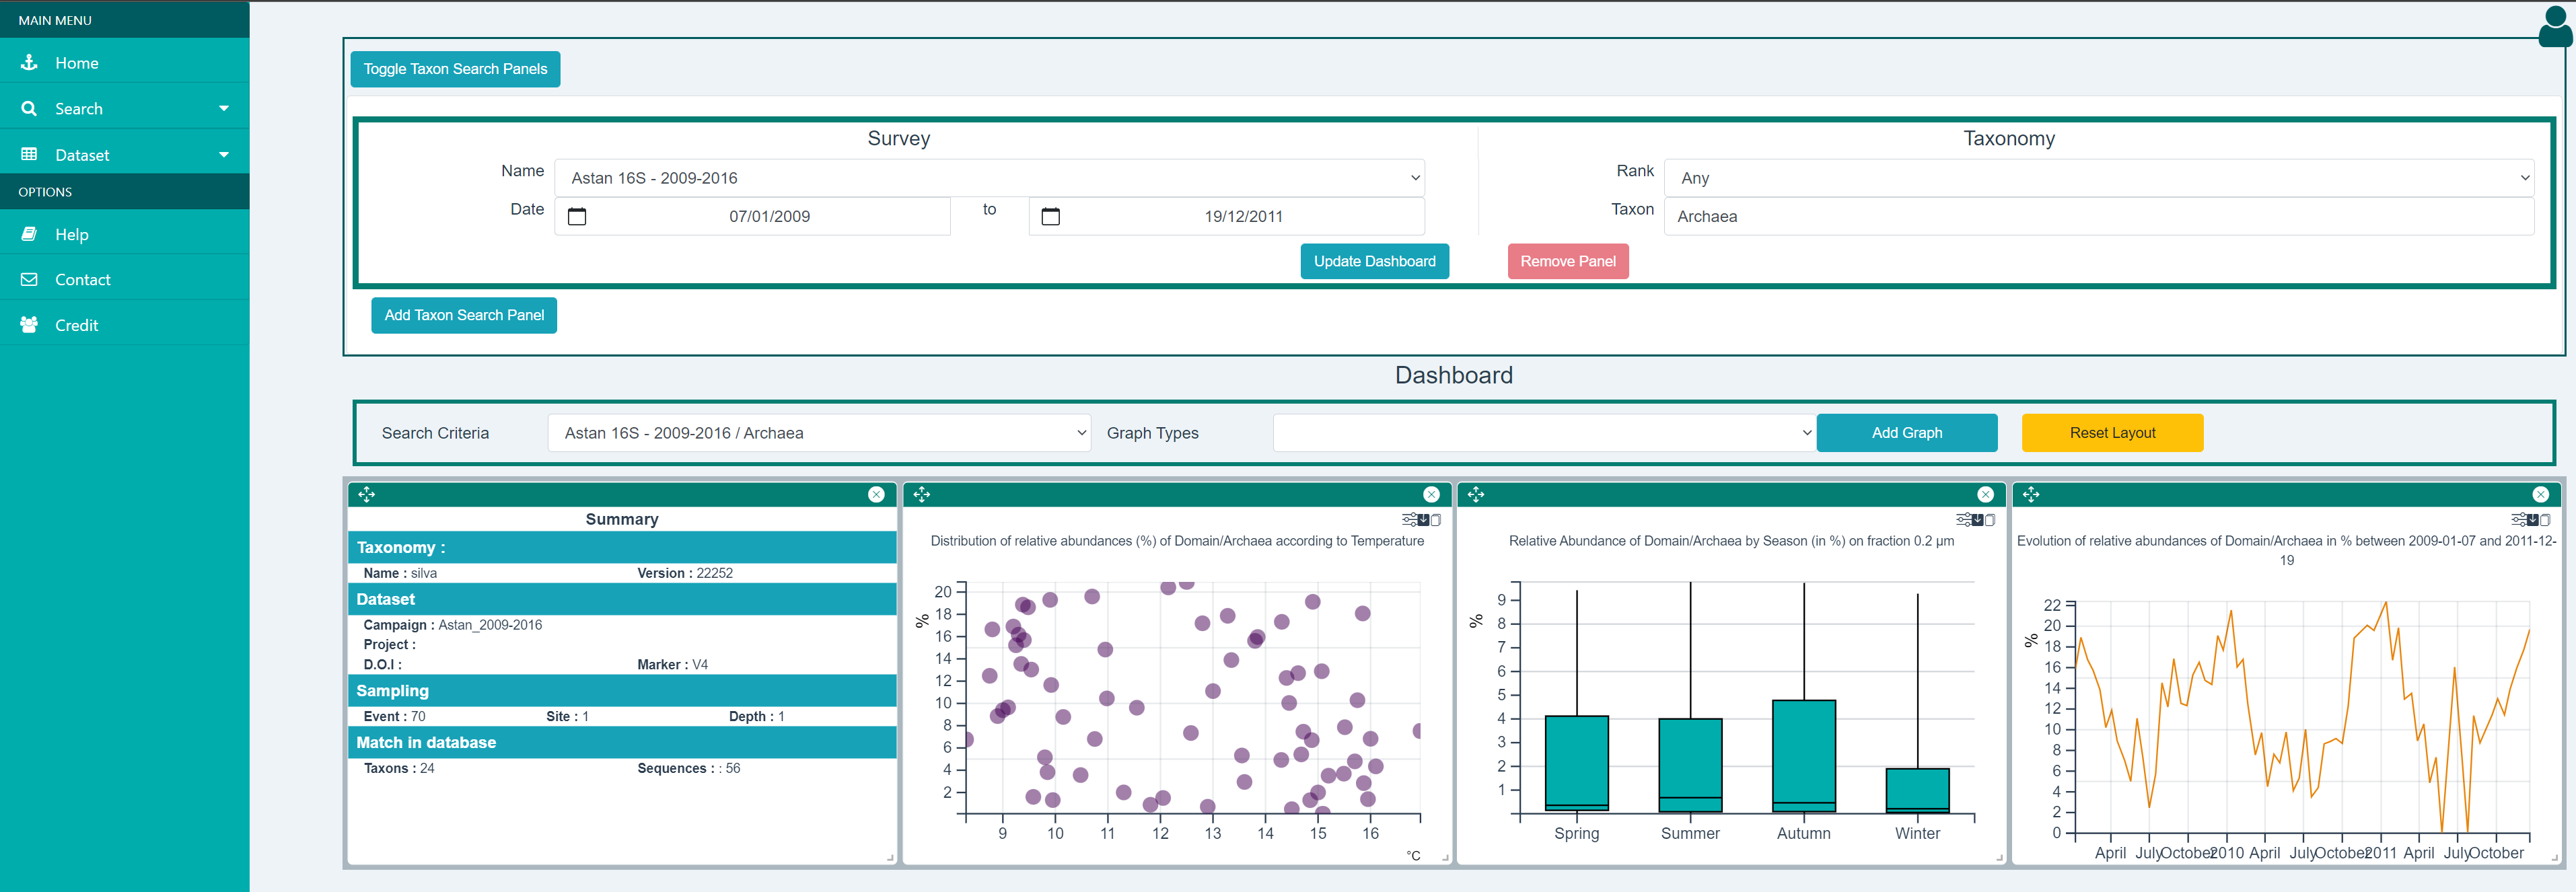
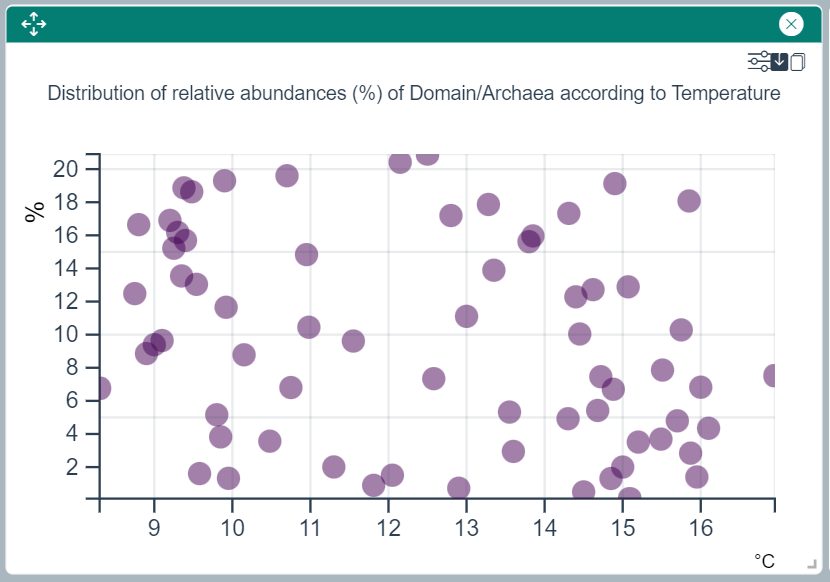
In the screenshot below, the dashboard was generated after selecting the "ASTAN 16S 2009-2016" dataset, entering "Archaea" in the "Taxon" textfield and clicking on the "Generate Dashboard" button. Detailed explanations on the graphical representations that are generated can be found in the Dashboard Widgets section below.
Using Multiple Taxon Search Criteria
The "Add Taxon Search Panel" button at the bottom of the Taxon Search section of the dashboard view will generate a new Taxon Search Panel below the previous one. This panel can be used to define completely different search criteria and to generate additional graphical representations in the dashboard. Each Taxon Search Panel has a specific border color. This color is reused for the graphical representations in the dashboard, and thus allows to easily identify which representations match a given Taxon Search Panel and vice versa.
When multiple Taxon Search Panels take up too much screen space, the "Toggle Taxon Search Panels" button can be used to collapse them.
Dashboard Widgets
Dashboard Widgets are graphical or textual components that can be added, resized, moved inside the dashboard canvas. Most of the widgets with graphical representation have an additional set of features that can be accessed by clicking on one of the icons on the right hand side, below the widget's top bar, as shown in the following screenshot.
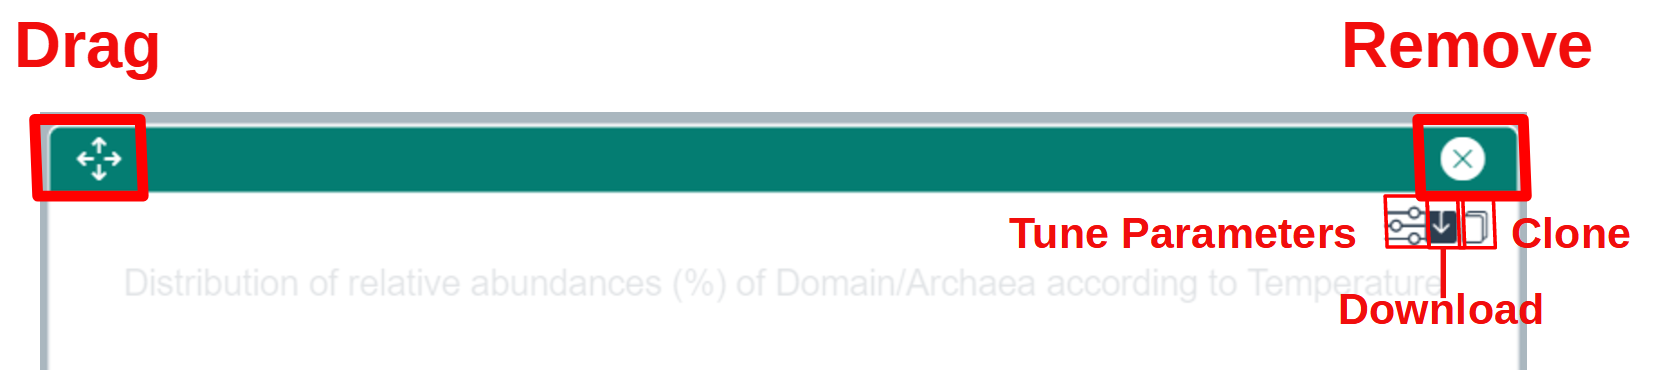
- The leftmost icon with the sliders ("Tune Parameters") opens a dialog window where most of the parameters specific to a given widget can be adjusted (selection of a taxon in one of the ranks below the rank selected in the Taxon Search Panel, switch between taxons and ASVs, change to another size fraction, select another physico-chemical parameter...).
- The middle icon with with the arrow ("Download") allows to download the graphical representation (PNG or SVG formats), metadata describing the contents of the plot, and in some cases the data itself. (Currently, data is returned as a JSON file. Work is ongoing to provide data in tabular format.)
- The rightmost icon ("Clone") generates a new widget with the exact same contents as the current widget. This is mostly useful in conjunction with the "Tune Parameters" icon to compare widgets when changing one ore more parameters.
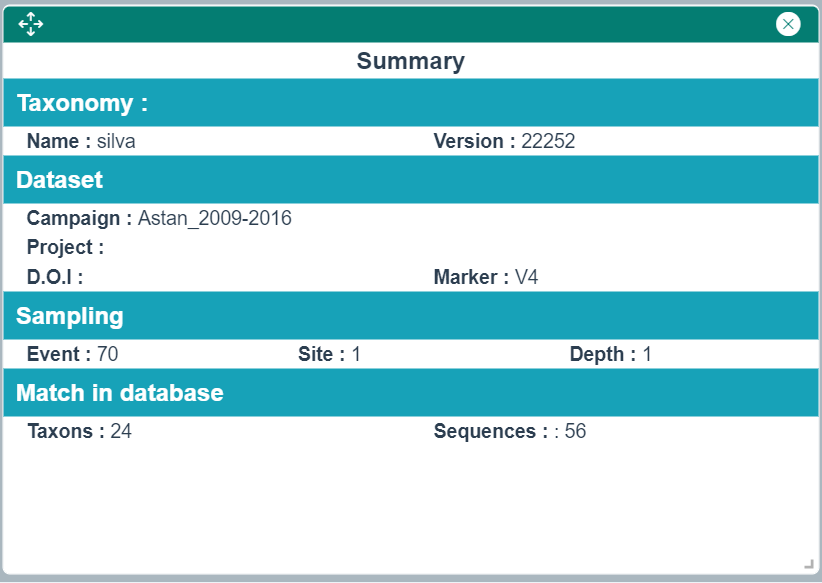
Summary Widget
This widget gives the essential information about the search criteria used to generate the dashboard as well as the search results.
Relative Abundances vs. Physico-chemical Parameter Plot
This widget draws a scatter plot with each dot representing the relative abundance of the selected taxon(s) or ASV(s) for each value of the currently selected physico-chemical parameter. The "Tune Parameters" icon can be used to select amongst the available phyisco-chemical parameters.
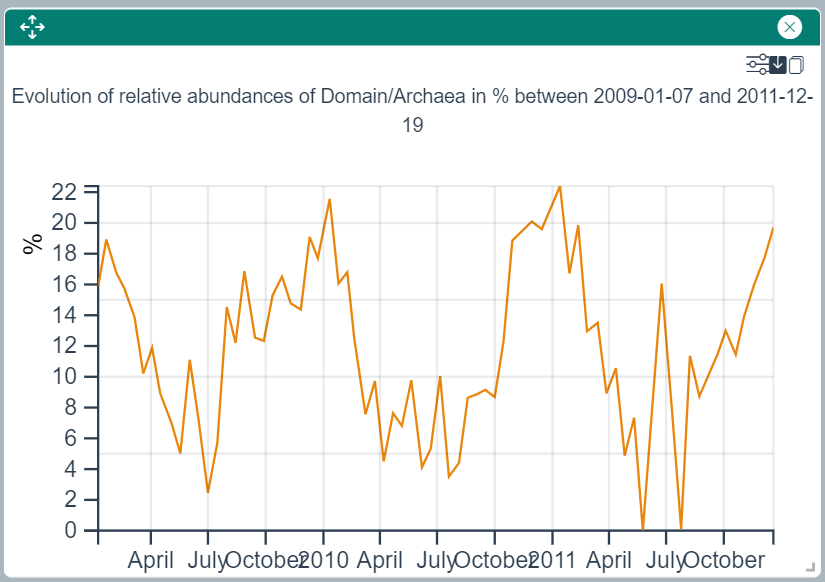
Relative Abundances over Time Plot
This widget draws a line plot showing the evolution of the relative abundace of the selected taxon(s) or ASV(s) over a date range.
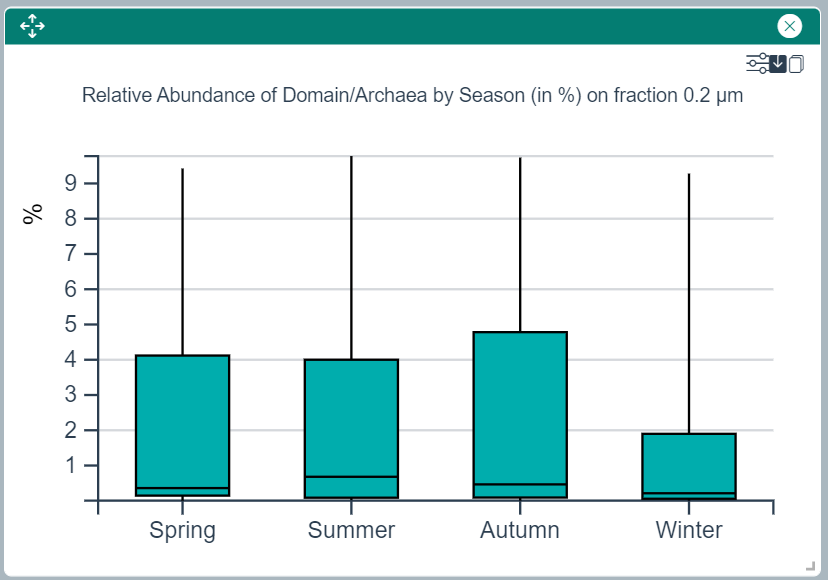
Seasonal Distribution of Relative Abundances Plot
This widget draws a boxplot showing the relative abundances of the selected taxon(s) or ASV(s) in each of the four seasons.
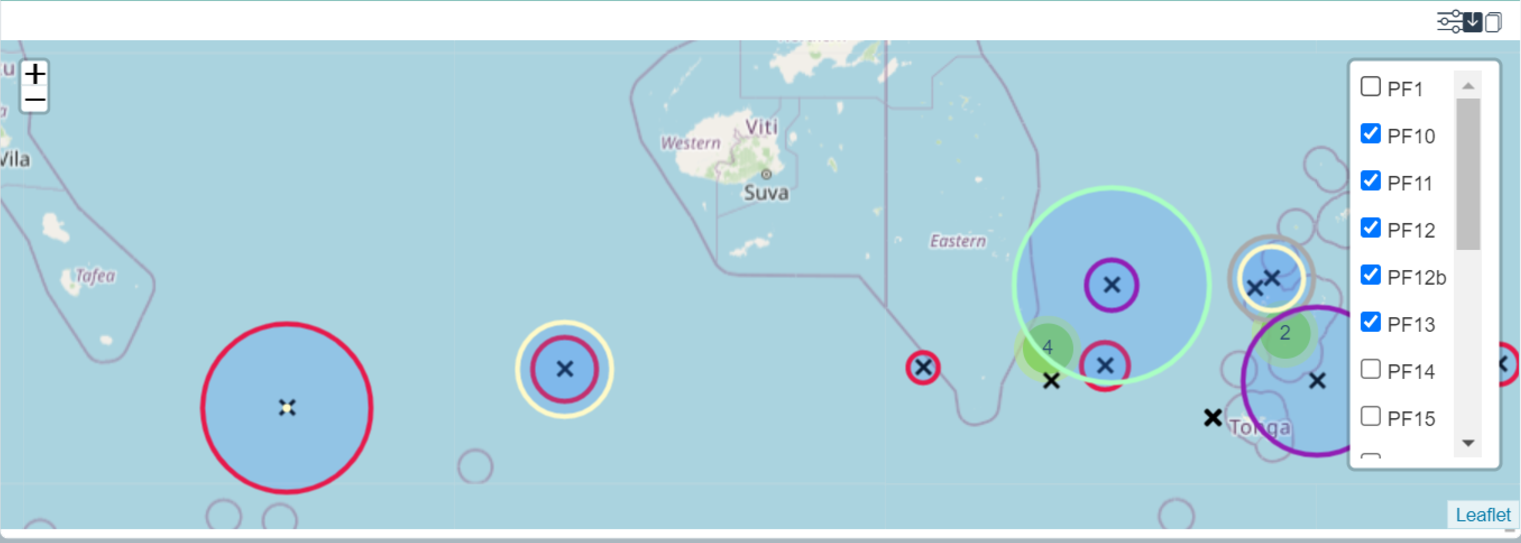
Sampling Location Map
This widget shows a map with the sampling locations (black crosses) as well as the relative abundances of the selected taxon(s) or ASV(s). Abundances are represented with circles having a radius proportional to their relative abundance. The circle colors match specific depth categories that have been defined for the dataset. Using the layer icon, in the top right corner of the map widget, it is possible to select one or several of these depth classes to compare relative abundances according to depth.
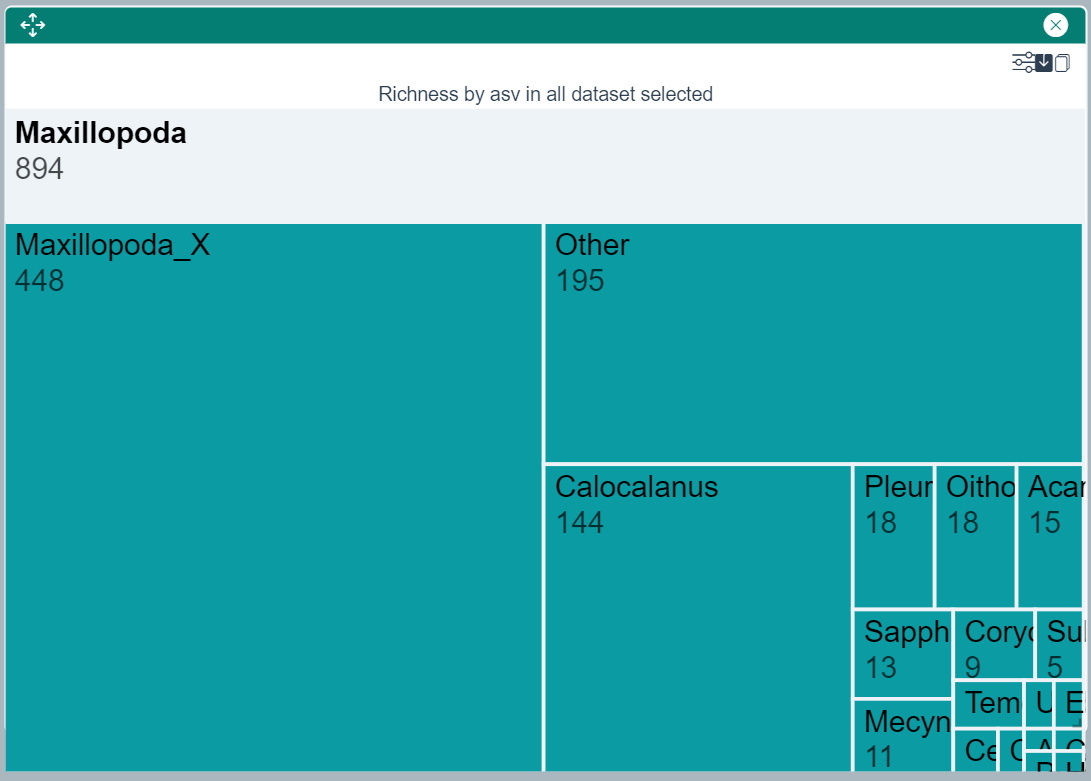
ASV Richness Tree Map - Alpha Diversity
This widget shows the richness of all ASVs matching the selected taxon and all of its descendents in the taxomic tree. Clicking on one of the rectangles of the tree map will focus the display on the newly selected taxon.
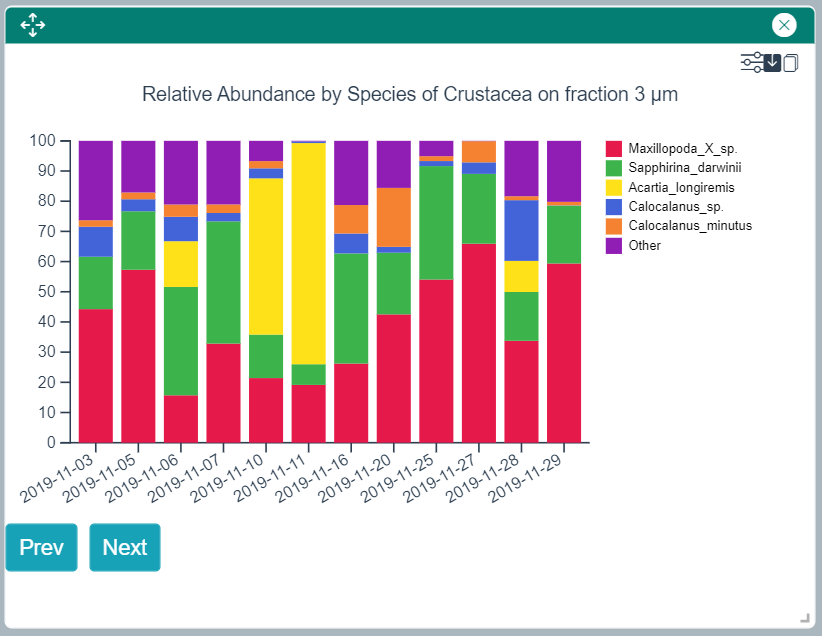
Relative Taxonomic Composition - Alpha Diversity
This widget shows a barchart with one bar per sampling date by default. Bars are subdivided according to the relative taxonomic decomposition starting at the rank defined in the Taxon Search Panel. The "Tune Parameters" icons allows to play with various settings, such as the taxonomic rank to use for the decomposition, the maximum number of bars to show in the plot, or the parameter used to build the bars (date, depth for example). The "Prev" and "Next" buttons at the bottom of the plot allow to move to the previous or next set of bars when not all bars are displayed on the plot.